Pydantic Logfire Guide: OpenTelemetry Tracing for AI
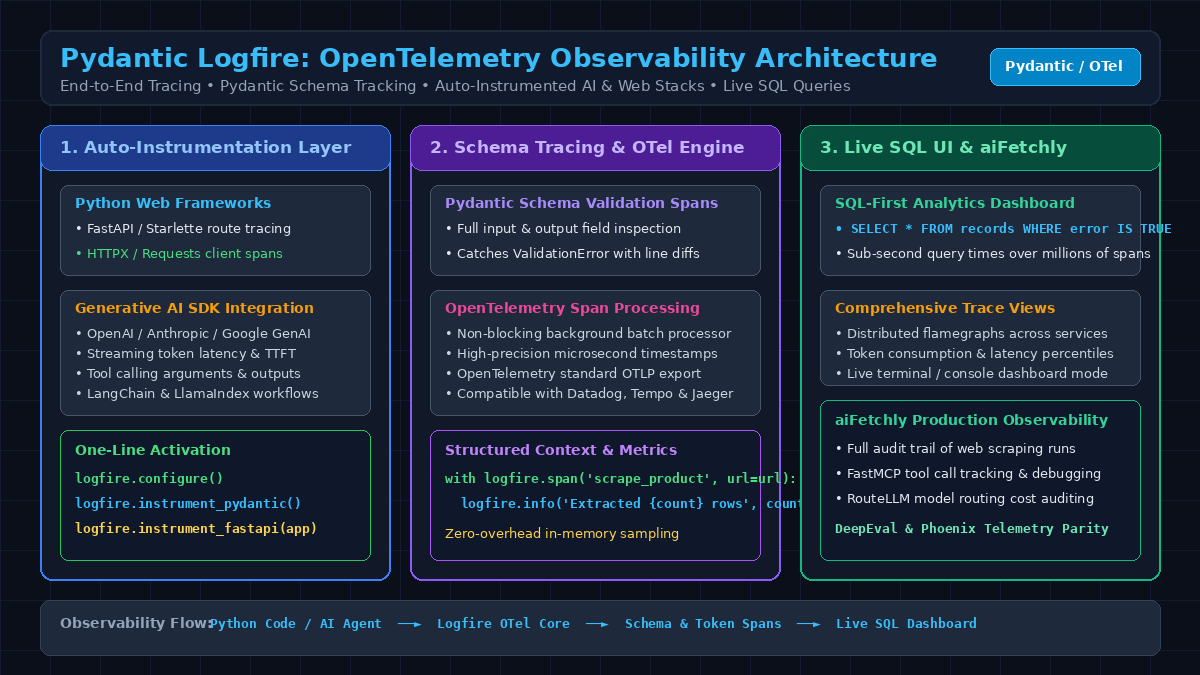
The Problem: The Observability Blind Spot in Modern AI Agent Stacks
In modern enterprise software, autonomous web data extraction, and real-time desktop copilots powered by AiFetchly, generative artificial intelligence has evolved far beyond isolated prompt-and-response interactions. Modern AI applications are complex compound agentic systems: coordinating web scrapers, headless browsers, vector database lookups, multi-step LLM reasoning loops, tool-calling dispatches, and strict Pydantic JSON schema validations.
However, software engineering teams attempting to monitor and debug these compound AI pipelines encounter a crippling telemetry divide: the observability blind spot between traditional Application Performance Monitoring (APM) and specialized LLM loggers.
The Production AI Observability Dilemma:
┌─────────────────────────────────────────────────────────────────┐
│ Approach 1: Traditional APM Tools (Datadog, New Relic)          │
│ • Monolithic HTTP routes, CPU metrics, and basic SQL timings    │
│ ❌ Total LLM Blindness: Blind to prompts, tokens, and streaming │
│ ❌ No Tool Context: Cannot inspect agent tool arguments/returns │
│ ❌ Schema Ignorance: Treats Pydantic validation as opaque errors│
├─────────────────────────────────────────────────────────────────┤
│ Approach 2: Standalone LLM Loggers (LangSmith, Phoenix)         │
│ • Traces prompt tokens, completions, and LLM latency            │
│ ❌ Application Blindness: Ignores web framework routes & auth   │
│ ❌ Database & Client Blindness: Misses HTTPX calls & SQL queries│
│ ❌ Fractured Stack: Forces teams to juggle two separate APMs    │
├─────────────────────────────────────────────────────────────────┤
│ Approach 3: Manual Logging & Raw OpenTelemetry Boilerplate      │
│ • Handcrafted logger.info() statements and raw OTel providers   │
│ ❌ High Boilerplate: Hundreds of lines of OTel setup code       │
│ ❌ Unstructured Chaos: 50-line terminal stack traces on crashes │
│ ❌ High Overhead: Custom serialization stalls async event loops │
└─────────────────────────────────────────────────────────────────┘
Result: Developers spend hours debugging silent schema failures and mystery latency spikes! 1. The Disconnect: APMs vs. Standalone LLM Trackers
Software engineers building production AI systems have historically been forced into an uncomfortable compromise:
- Traditional APMs (Datadog, New Relic, Dynatrace): Built for microservices, they excel at monitoring HTTP latency and database queries. However, they have zero native comprehension of generative AI: they cannot parse token usage, cannot reconstruct multi-turn dialogue trees, and treat LLM streaming connections as generic long-lived HTTP sockets.
- Standalone LLM Observability Tools: Platforms designed exclusively for LLMs track model prompts and completions well, but they are completely blind to the surrounding application infrastructure. When an agent fails because an upstream HTTP request to a scraped website timed out or an internal database transaction rolled back, standalone LLM tools offer zero context.
- Teams are left juggling two incompatible monitoring dashboards with disjointed trace IDs.
2. The Silent Epidemic of Pydantic Validation Failures
In enterprise AI engineering, foundation models are instructed to emit structured data conforming to typed schemas (via Pydantic models).
- When a language model hallucinates an invalid enum, omits a mandatory field, or returns a string instead of a floating-point number, Pydantic raises a
ValidationError. - In standard logging setups, this error produces a massive, impenetrable text stack trace in server logs.
- Developers cannot easily see the exact raw JSON payload emitted by the model, cannot see which specific field triggered the rejection, and cannot trace which user prompt or tool call caused the malformed output.
3. The Boilerplate Tax of Raw OpenTelemetry SDKs
While OpenTelemetry (OTel) has emerged as the global standard for distributed tracing, implementing it from scratch in Python is an operational nightmare:
- Configuring
TracerProvider,BatchSpanProcessor, OTLP exporters, and context propagation across asynchronousasyncioevent loops requires dozens of lines of delicate boilerplate. - A single unhandled exception in an OTel exporter can block application threads or exhaust memory buffers during high-throughput workloads.
The Solution: Pydantic Logfire’s Unified Observability Architecture
To unite application performance monitoring, structured data validation, and generative AI tracing into a single seamless platform, Samuel Colvin and the Pydantic core engineering team introduced Pydantic Logfire.
Logfire is an OpenTelemetry-native observability platform designed specifically for Python, web services, and AI agent architectures. Built directly on top of the OpenTelemetry standard with zero proprietary lock-in, Logfire delivers deep schema-aware Pydantic tracing, one-line automated instrumentation for modern AI and web frameworks, and an interactive SQL-first analytics dashboard powered by high-speed columnar storage.
Pydantic Logfire Full-Stack Telemetry Topology:
┌─────────────────────────────────────────────────────────────────┐
│ Application Execution Layer (aiFetchly Agent / Desktop Copilot) │
│ • FastAPI Web Services  • Pydantic v2 Validation Models         │
│ • HTTPX Web Scrapers    • OpenAI / Anthropic Generative Models  │
└────────────────────────────────┬────────────────────────────────┘
                                 │
     (Automatic Instrumentation Hooks via OpenTelemetry Core)
                                 ▼
┌─────────────────────────────────────────────────────────────────┐
│ Logfire Tracing Core & In-Process Span Processor                │
│ • Zero-Config Auto-Tracing: logfire.configure()                 │
│ • Deep Schema Inspector: Captures model fields & validation diff│
│ • Async Non-Blocking Exporter: Microsecond batch dispatch       │
└────────────────────────────────┬────────────────────────────────┘
                                 │
     (Transmits OTLP Spans via High-Speed Background Stream)
                                 ▼
┌─────────────────────────────────────────────────────────────────┐
│ Logfire Cloud / Self-Hosted Columnar Storage Engine             │
│ • Stores structured spans, traces, exceptions, and metrics      │
│ • Standard OTel Compatibility: Export to Jaeger, Tempo, Datadog │
└────────────────────────────────┬────────────────────────────────┘
                                 │
                                 ▼
┌─────────────────────────────────────────────────────────────────┐
│ Interactive Developer Interfaces & Query Tools                  │
│ • Live SQL Query Engine: SELECT * FROM records WHERE ...        │
│ • Distributed Flamegraph Trace Explorer with Token Metrics      │
│ • Rich Terminal & Console Mode for Local Workstation Debugging  │
└─────────────────────────────────────────────────────────────────┘ The Architectural Pillars of Pydantic Logfire
- Native OpenTelemetry Foundation with Zero Lock-In: Logfire does not invent a proprietary wire protocol. Under the hood, it generates standard OpenTelemetry spans, metrics, and logs. Developers can export telemetry seamlessly to Logfire’s optimized cloud platform, or route data to self-hosted Jaeger, Grafana Tempo, or Datadog instances without changing application code.
- Deep Pydantic Schema-Aware Tracing: Because it is built by the Pydantic team, Logfire integrates directly with Pydantic v2’s Rust-based validation core. Every time a model validates data, Logfire records the execution time, input data, and schema definitions. If a
ValidationErroroccurs, Logfire surfaces a formatted, visual field-by-field diff showing exactly which key failed and why. - One-Line Automatic Ecosystem Instrumentation: Logfire provides instant instrumentation modules across the entire Python stack:
- Web Frameworks:
FastAPI,Starlette,Django,Flask. - HTTP Clients:
HTTPX,Requests,AIOHTTP. - AI Providers:
OpenAI,Anthropic,Google GenAI,LangChain,LlamaIndex. - Databases:
SQLAlchemy,SQLModel,Psycopg,AsyncPG.
- Web Frameworks:
- SQL-First Analytical Query Engine: Unlike traditional log viewers that rely on brittle text search or obscure proprietary query languages, Logfire stores telemetry in a high-speed columnar database. Developers query their production logs and spans using standard ANSI SQL (
SELECT * FROM spans WHERE duration > 1.5 AND attributes['model'] = 'gpt-4o'), unlocking instant quantitative analytics. - Live Terminal and Console Dashboard: During local development and testing, Logfire renders interactive, colorized flamegraphs and structured trace logs directly in the developer’s terminal, allowing immediate inspection of agent reasoning steps without opening a browser window.
Comparing Observability Paradigms
The table below contrasts traditional APMs, standalone LLM loggers, and Pydantic Logfire:
Observability Platform Comparison:
┌───────────────────────────┬───────────────────────────────┬───────────────────────────────┬───────────────────────────────┐
│ Capability / Dimension    │ Traditional APM (Datadog)     │ Standalone LLM (LangSmith)    │ Pydantic Logfire              │
├───────────────────────────┼───────────────────────────────┼───────────────────────────────┼───────────────────────────────┤
│ Telemetry Standard        │ Proprietary Agent / OTel Shim │ Proprietary JSON Schema       │ Pure Native OpenTelemetry     │
│ Python Stack Tracing      │ ✅ HTTP & Database queries    │ ❌ Blind to web/DB stack      │ ✅ Full-Stack Python Tracing  │
│ LLM & Token Tracing       │ ❌ Basic span timings only    │ ✅ Prompts, tokens, streaming │ ✅ Native LLM Token & Streams │
│ Pydantic Schema Tracking  │ ❌ Opaque exception strings   │ ❌ No schema validation diffs │ ✅ Native Schema Diffs & Valid│
│ Analytical Query Language │ Proprietary Query Syntax      │ Limited Filter UI             │ Standard ANSI SQL             │
│ Local Terminal Mode       │ ❌ Web dashboard only         │ ❌ Cloud UI only              │ ✅ Rich Interactive Terminal  │
│ Vendor Lock-In            │ High proprietary lock-in      │ High framework lock-in        │ Zero (Standard OTLP Export)   │
│ Setup Complexity          │ Heavy daemon installation     │ Framework-specific wrappers   │ One line: logfire.configure() │
└───────────────────────────┴───────────────────────────────┴───────────────────────────────┴───────────────────────────────┘ Deep Dive into Logfire Core Subsystems & Tracing Lifecycle
To master Pydantic Logfire in enterprise production, software engineers must understand how its internal architecture handles asynchronous span batching, schema inspection, and SQL-based trace analytics.
Logfire Internal Runtime Engine:
Logfire Runtime
 ├──► 1. Configuration Hub: Initializes global OpenTelemetry TracerProvider and MeterProvider
 ├──► 2. Schema Interceptor: Hooks Pydantic v2 core validation routines for zero-cost inspection
 ├──► 3. Auto-Instrumentors: Binds ASGI middleware, HTTP client transports, and LLM completions
 ├──► 4. Asynchronous Batch Exporter: Streams OTLP Protobuf records over non-blocking gRPC/HTTP
└──► 5. Columnar Analytics Store: Indexes spans into queryable relational SQL tables 1. The OpenTelemetry Span Processor and Batch Exporter
When an application invokes functions instrumented by Logfire:
- The framework creates lightweight OpenTelemetry
Spanobjects that track start timestamps, parent-child relationships, span kinds (server, client, internal), and structured attributes. - Context is propagated across asynchronous task boundaries using Python’s standard
contextvars, ensuring that concurrentasyncio.create_taskroutines maintain accurate distributed trace trees. - Rather than serializing and transmitting spans synchronously (which would add latency to critical request paths), Logfire queues spans in a thread-safe ring buffer.
- A dedicated background worker thread periodically flushes micro-batches of Protobuf-encoded OTLP payloads to the Logfire collector over HTTP/2 or gRPC, ensuring zero measurable impact on user-facing request latency.
2. Schema Validation Tracing (logfire.instrument_pydantic)
Pydantic v2 is implemented in Rust (pydantic-core) for maximum validation speed:
- When
logfire.instrument_pydantic()is invoked, Logfire registers lightweight C-API callbacks directly with the validation engine. - Every time a Pydantic model (
BaseModel) or dataclass is instantiated:- Logfire captures the input data dictionary.
- It measures the exact validation time in microseconds.
- If validation succeeds, it records the typed output fields.
- If validation fails, it intercepts the
ValidationErrorand serializes the exact path (e.g.,response.items[2].price), expected type, and actual offending value, embedding them directly into the span attributes.
3. Structured Logging with Dynamic Templating
Traditional loggers use static string interpolation (logger.info(f"User {uid} purchased {item}")), which destroys structured queryability:
- Logfire uses Python string formatting templates:
logfire.info("User \{user_id\} scraped \{url\}", user_id=uid, url=target_url) - The framework preserves both the formatted human-readable message and a structured dictionary of typed attributes (
user_id,url). - When viewed in the Logfire dashboard or terminal, developers can filter, group, or aggregate by
user_idorurlwithout complex regex parsing.
4. Live SQL Querying over Telemetry Streams
Logfire persists incoming telemetry into a columnar database modeled around relational concepts:
- Developers can execute real-time SQL queries over the
recordstable:
SELECT
    attributes->>'model' AS model_name,
    COUNT(*) AS total_calls,
    ROUND(AVG(duration), 3) AS avg_duration_sec,
    SUM((attributes->'usage'->>'total_tokens')::int) AS total_tokens_consumed
FROM records
WHERE span_name = 'chat'
GROUP BY 1
ORDER BY total_tokens_consumed DESC; This transforms telemetry from a passive debugging tool into an active operational intelligence engine.
Hands-On Implementation: Instrumenting AI Pipelines with Logfire
Let’s walk through installing Logfire, auto-instrumenting a FastAPI web service, tracing a multi-step agent extraction pipeline with Pydantic validation, and querying execution traces with SQL.
1. Environment Setup and Installation
Install logfire along with support for FastAPI, HTTPX, and OpenAI:
# Create a fresh Python environment
conda create -n logfire-env python=3.10 -y
conda activate logfire-env

# Install Logfire with all common instrumentation extras
pip install "logfire[fastapi,httpx,openai,pydantic]" Authenticate your local machine with Logfire (or configure local terminal-only mode):
# Authenticate with Logfire Cloud (creates a project in seconds)
logfire auth 2. Auto-Instrumenting Web Frameworks and Model SDKs
In your application entry point, configure Logfire with a single initialization call:
import logfire
from fastapi import FastAPI
from openai import OpenAI
import httpx

# 1. Initialize Logfire
logfire.configure(
    service_name="aifetchly-extractor-agent",
    send_to_logfire=True  # Set to False or 'console' for local terminal-only tracing
)

# 2. Automatically instrument all major frameworks
app = FastAPI(title="aiFetchly Agent Service")
logfire.instrument_fastapi(app)
logfire.instrument_pydantic()
logfire.instrument_httpx()

# Initialize OpenAI client with automatic trace instrumentation
client = OpenAI()
logfire.instrument_openai(client) 3. Tracing a Multi-Step AI Extraction Workflow with Pydantic Validation
Here is a complete, production-grade agent function that fetches a web document, uses an LLM to extract structured pricing records, and validates the output against a strict Pydantic model:
from typing import List, Optional
from pydantic import BaseModel, Field, HttpUrl
import logfire

# Define strict Pydantic extraction schema
class ProductPriceItem(BaseModel):
    product_name: str = Field(description="Name of the product")
    price_usd: float = Field(ge=0.0, description="Price in USD")
    in_stock: bool = Field(description="Availability status")
    sku: Optional[str] = Field(default=None, description="Stock Keeping Unit")

class ScrapedCatalog(BaseModel):
    store_name: str
    items: List[ProductPriceItem]

# Execute agent extraction within a custom Logfire span
def extract_catalog_data(raw_html: str, source_url: str) -> ScrapedCatalog:
    with logfire.span("agent.extract_catalog", url=source_url):
        logfire.info("Starting schema extraction for {url}", url=source_url)

        # Call LLM with structured output instruction
        completion = client.beta.chat.completions.parse(
            model="gpt-4o-mini",
            messages=[
                {"role": "system", "content": "Extract structured product pricing from the provided HTML."},
                {"role": "user", "content": raw_html}
            ],
            response_format=ScrapedCatalog
        )

        parsed_result = completion.choices[0].message.parsed

        logfire.info(
            "Successfully extracted {count} items from {store}",
            count=len(parsed_result.items),
            store=parsed_result.store_name
        )
return parsed_result If the LLM emits a negative price (violating price_usd: float = Field(ge=0.0)), Logfire automatically captures the ValidationError, marks the parent span as an error, and displays the exact violating field and value in the trace flamegraph.
4. Querying Spans and Telemetry via SQL
Developers can query Logfire programmatically or through the live web console. For example, to identify all agent extraction failures and group them by error type:
SELECT
    start_timestamp,
    span_name,
    attributes->>'url' AS scraped_url,
    attributes->>'exception.message' AS error_message
FROM records
WHERE level = 'error'
  AND span_name = 'agent.extract_catalog'
ORDER BY start_timestamp DESC
LIMIT 10; Production Architecture & Agent Observability for aiFetchly
In automated data extraction, competitor price monitoring, and desktop developer copilots powered by AiFetchly, deploying Pydantic Logfire provides the observability foundation for reliable, multi-tenant AI operations.
aiFetchly Production Observability Stack with Logfire:
┌─────────────────────────────────────────────────────────────────┐
│ aiFetchly Desktop Application & Autonomous Web Scraper Worker   │
└────────────────────────────────┬────────────────────────────────┘
                                 │
     (Emits Continuous OpenTelemetry Spans & Schema Validations)
                                 ▼
┌─────────────────────────────────────────────────────────────────┐
│ Pydantic Logfire In-Process Telemetry Agent                     │
│ • Traces HTTPX DOM scraping & dynamic headless page rehydration │
│ • Validates extracted JSON against Pydantic domain models       │
│ • Captures FastMCP tool parameters and execution latency        │
└───────────────────┬─────────────────────────────────┬───────────┘
                    │                                 │
     (Inspects Routing Efficiency)          (Verifies Retrieval Precision)
                    ▼                                 ▼
┌───────────────────────────────────────┐ ┌───────────────────────────────┐
│ RouteLLM Dynamic Dispatch Tracing     │ │ Infinity Embedding & Rerank   │
│ • Traces weak vs. strong model splits │ │ • Profiles vector search time │
│ • Tracks cost savings per tenant      │ │ • Logs cross-encoder latency  │
└───────────────────────────────────────┘ └───────────────────────────────┘
                    │                                 │
                    └────────────────┬────────────────┘
                                     │
                                     ▼
┌─────────────────────────────────────────────────────────────────┐
│ Unified Logfire Analytics Dashboard & OTel Exporter             │
│ • Real-time SQL queries over scraping runs & token usage        │
│ • Automated alerts on schema validation failure spikes          │
│ • DeepEval regression testing & Arize Phoenix telemetry parity  │
└─────────────────────────────────────────────────────────────────┘ 1. High-Volume Web Scraping & Schema Validation Auditing
When AiFetchly crawls e-commerce stores, real estate listings, and financial portals:
- Web pages undergo frequent DOM updates, class name hashing, and A/B test variations that cause extraction prompts to fail.
- With Logfire active, every scraping job is tracked as an integrated trace: from the initial HTTPX network call to the LLM completion and final Pydantic model validation.
- When an extraction job fails, engineers query Logfire with SQL to instantly determine whether the failure was caused by a 403 HTTP block, an LLM timeout, or an unparseable date format in the Pydantic model.
2. Multi-Agent Ecosystem Interoperability
Logfire seamlessly instruments modern multi-agent architectures:
- FastMCP Tool Instrumentation: Wrap Model Context Protocol servers built with FastMCP using
@logfire.instrument, capturing incoming tool arguments, execution duration, and serialized outputs. - Workflow State Machines with LangGraph: Track agent state transitions, cyclical loops, and branch decisions in LangGraph, identifying runaway recursion before token budgets are exhausted.
- Cost-Optimized Model Routing: Trace dynamic model selections made by RouteLLM and local Apple MLX inference runs, quantifying exact dollar savings per tenant.
- Two-Stage RAG Pipeline Profiling: Monitor dense vector retrieval in ChromaDB alongside cross-encoder reranking in Infinity to isolate sub-millisecond retrieval bottlenecks.
- Sandboxed Execution in E2B: Trace dynamic code interpretation tasks running inside isolated E2B Firecracker microVMs.
- Automated Regression Testing: Correlate production traces with unit test assertions in DeepEval and OpenTelemetry traces in Arize Phoenix.
Summary: Observability as the Backbone of Production AI
As artificial intelligence transitions from experimental conversational prompts to autonomous, multi-step agentic systems, traditional logging is no longer sufficient.
By unifying OpenTelemetry distributed tracing, deep Pydantic schema validation tracking, and interactive SQL-based analytics into an ergonomic Python framework, Pydantic Logfire eliminates the visibility gap that has plagued compound AI systems. Whether monitoring high-volume web scraping pipelines, debugging complex agent tool calls, or verifying schema compliance in AiFetchly, Pydantic Logfire provides the reliability, transparency, and operational control required for enterprise-grade artificial intelligence.