Inside aiFetchly Operations Dashboard: Workflow Governance
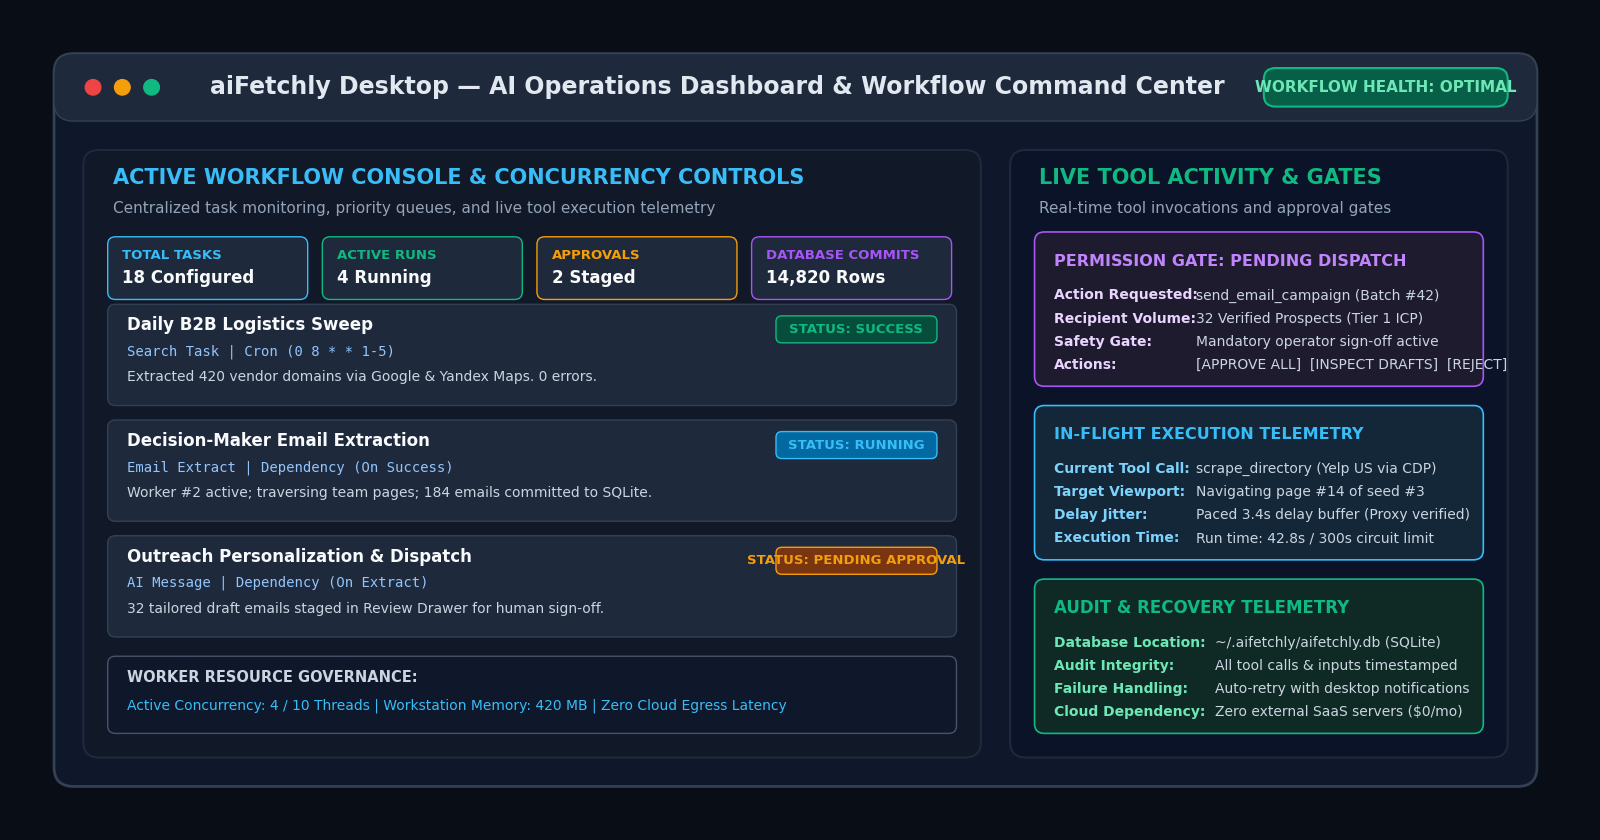
The Visibility Gap in Multi-Agent Desktop Automation
As power users scale automated business operations—orchestrating daily web scrapers, contact enrichment pipelines, and scheduled AI reasoning loops—operational complexity multiplies rapidly. Running multiple autonomous jobs in the background introduces severe visibility and governance challenges:
- Silent Workflow Failures: Without centralized monitoring, a rate-limited proxy or expired API token halts overnight extractions unnoticed until morning.
- Uncontrolled Resource Contention: Unthrottled background tasks can trigger CPU and memory spikes, slowing down active workstation tasks.
- Opaque Black-Box Execution: Operators lack visibility into which tools an autonomous agent invoked, what parameters were evaluated, or why a decision was reached.
AI Fetchly resolves these operational bottlenecks through its centralized AI Operations Dashboard. Serving as the mission control plane for desktop automation, it unifies task tracking, concurrency management, and tamper-resistant auditing into a single local console.
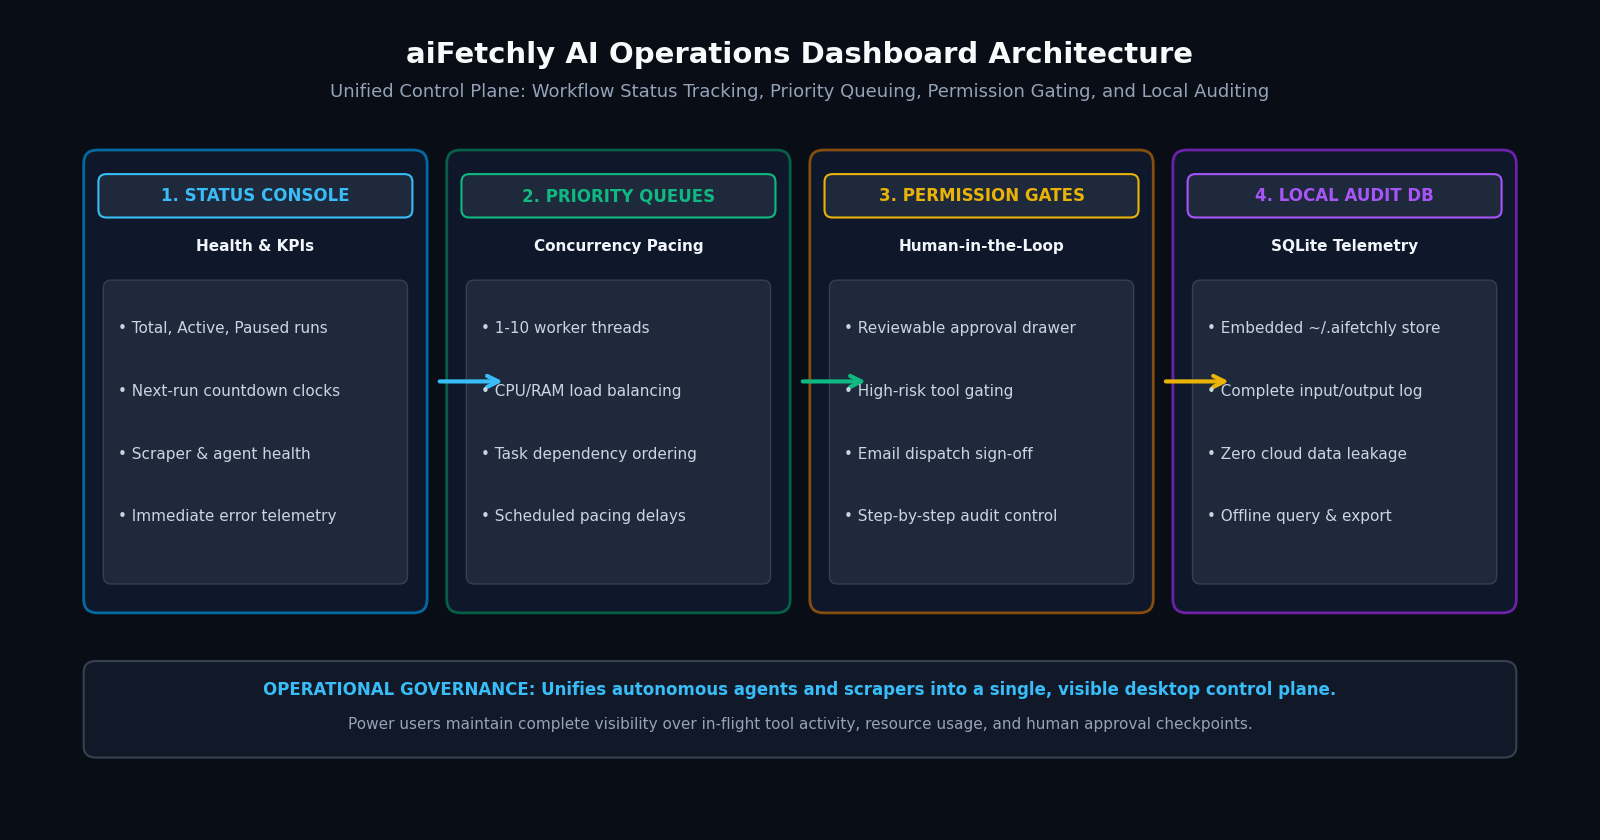
1. Centralized Task Health & Schedule Telemetry
Rather than checking separate log files or hunting across menus, the Operations Dashboard aggregates all background processes into real-time health cards:
- Universal Status Overview: Displays instantaneous counts of Total, Active, Paused, and Failed workflows across search scrapers, email extractors, and Task Scheduler AI Message agents.
- Next-Run Telemetry: Calculates exact countdown timers for upcoming cron recurrences and event-driven dependency triggers.
- Immediate Error Diagnostics: Flags stalled worker threads or challenge walls instantly, allowing operators to trigger retries with one click.
2. Priority Queuing and Worker Concurrency
Workstation stability requires intelligent resource budgeting. The dashboard allows power users to configure execution priority tiers:
- Concurrency Limits (1–10 Threads): Controls parallel worker instances, balancing high-throughput web scraping against local system memory.
- Dependency Execution Sequencing: Ensures downstream AI analysis tasks execute only after upstream data harvesting completes successfully.
- Adaptive Delay Buffers: Injects randomized pacing buffers (2–5 seconds) to maintain proxy health and prevent search engine rate limits.
3. Human-in-the-Loop Permission Gates
Unattended automation must remain controllable. The Operations Dashboard features a dedicated Reviewable Approval Drawer:
- Staged Execution Gates: High-impact operations (such as outbound email campaign dispatches or filesystem updates) halt at pre-configured gates for manual operator sign-off.
- In-Situ Payload Inspection: Review exact recipient lists, generated copy drafts, and tool arguments before permitting execution.
4. Tamper-Resistant Local SQLite Ledgers
Every workflow event, tool execution parameter, token consumption metric, and human approval decision commits directly to ~/.aifetchly/aifetchly.db. Operators retain full historical compliance records and offline auditability on local NVMe storage with zero cloud middlebox telemetry.
By combining real-time visibility with strict execution governance, aiFetchly transforms desktop automation into an enterprise-grade operations hub.
Explore complete dashboard controls in the AI Fetchly Docs.
Visual Generation Prompts
Hero Image Prompt:Modern dark-mode SaaS developer dashboard showing the aiFetchly AI Operations Dashboard, displaying real-time KPI metric pills (Total Tasks, Active Runs, Approvals Staged, Database Commits), an active workflow list with green and cyan status badges, an open permission approval drawer, and live worker resource telemetry, sleek isometric 3D perspective, slate-900 background with cyan and emerald accents.Body Image Prompt:High-resolution technical pipeline flowchart illustrating the aiFetchly AI Operations Dashboard Architecture: Status Console (KPIs and countdown clocks), Priority Queues (concurrency limits and dependency ordering), Permission Gates (human-in-the-loop approval drawers), and Local SQLite Audit Database (~/.aifetchly), clean dark vector blueprint styling.