FLARE Guide: Anomaly Diagnostics for Massive LLM Training
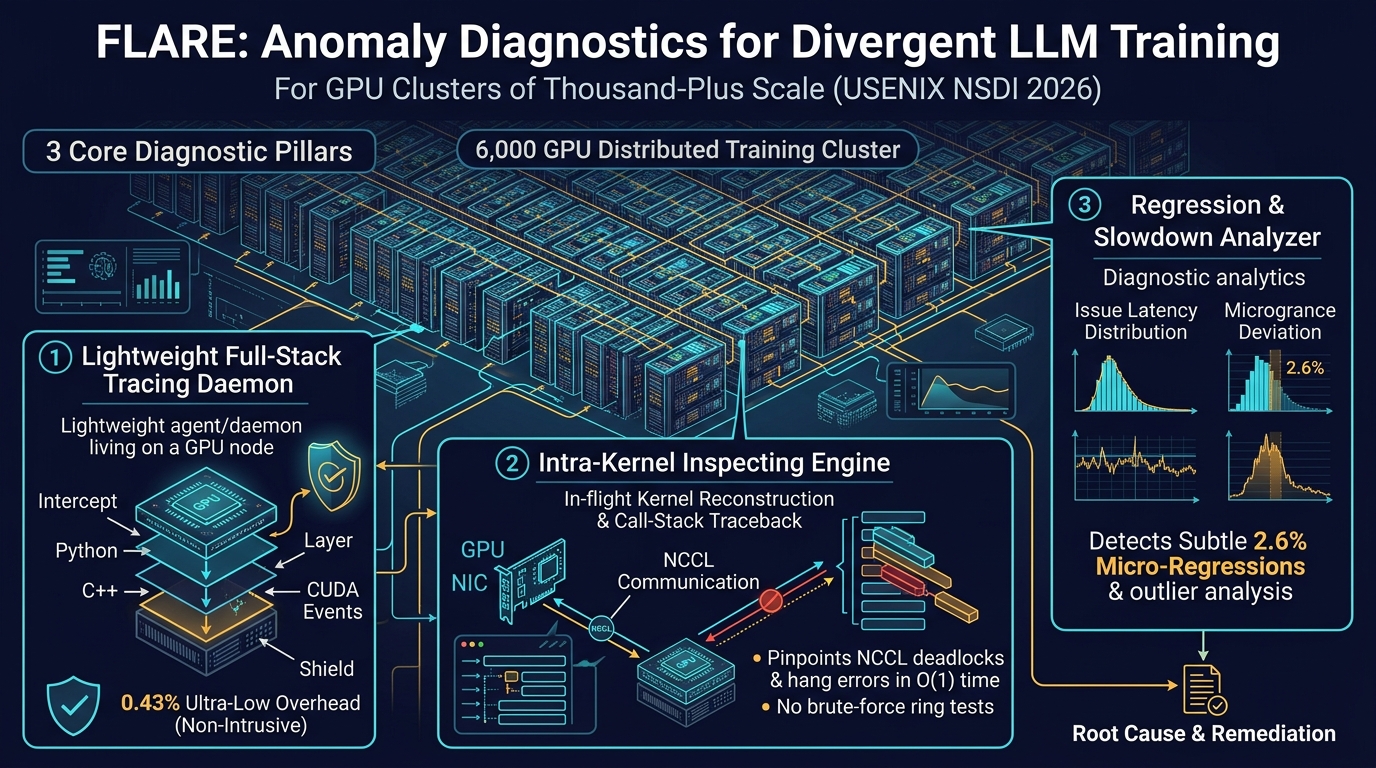
The Billion-Dollar Reliability Crisis in Large-Scale LLM Training
In modern artificial intelligence engineering, automated market intelligence platforms, and desktop copilots powered by aiFetchly, foundation models are trained on hundreds of billions or trillions of tokens. Whether processing dense technical corpora harvested via automated web scraping, ingesting financial tables through real-time data fetching, or orchestrating enterprise automations with custom API integrations, frontier capabilities demand enormous computational investment.
Training modern 70B to 400B+ parameter models requires scaling across massive distributed GPU clusters—often spanning 1,024 to over 6,000 high-end accelerators (such as NVIDIA H100, H800, or A100 GPUs) interconnected via 400Gbps InfiniBand or RoCE fabrics. These training runs operate continuously for weeks or months, costing tens of millions of dollars in compute, power, and infrastructure.
However, distributed LLM training at thousand-plus scale is notoriously fragile. Unlike traditional decoupled microservices, distributed training employs complex 3D hybrid parallelism:
- Data Parallelism (DP / ZeRO): Shards optimizer states and gradients across ranks.
- Tensor Parallelism (TP): Splits intra-layer matrix multiplications across GPUs via high-bandwidth NVLink.
- Pipeline Parallelism (PP): Sequences transformer layers across pipeline stages.
- Sequence / Context Parallelism (CP): Distributes long attention sequences across multiple nodes.
Because all GPUs in a training run are tightly synchronized via collective communication operations (such as All-Reduce, Reduce-Scatter, and All-Gather), the entire 6,000-GPU cluster is bound to the speed of its single slowest component.
The Synchronous Vulnerability in Massive Distributed Training:
┌────────────────────────────────────────────────────────────────────────┐
│ 6,000-GPU Synchronous All-Reduce Barrier                               │
│ GPU 1    [Compute Forward/Backward: 120ms] ──► [Wait All-Reduce: 85ms] │
│ GPU 2    [Compute Forward/Backward: 119ms] ──► [Wait All-Reduce: 86ms] │
│ ...                                                                    │
│ GPU 412  [Compute Forward/Backward: 205ms] ──► [Wait All-Reduce: 0ms]  │  ◄── Thermal Straggler!
│ ...                                                                    │
│ GPU 6000 [Compute Forward/Backward: 121ms] ──► [Wait All-Reduce: 84ms] │
└────────────────────────────────────────────────────────────────────────┘
  ▲ 5,999 GPUs sit completely IDLE for 85ms waiting for a single slow node!
Wastes millions of dollars in idle cluster energy and GPU hours! If a single GPU suffers a thermal throttle, an optical transceiver drops packets, or an asynchronous collective deadlocks, the entire multi-million-dollar cluster halts or suffers massive throughput collapse.
The Three Categories of Training Anomalies
Production telemetry across enterprise supercomputing clusters reveals that training anomalies fall into three distinct, punishing categories:
The Three Major Categories of Distributed Training Anomalies:
┌────────────────────────────────────────────────────────────────────────┐
│ 1. Runtime Hangs & Communication Deadlocks                             │
│ • An NCCL collective hangs due to missing CUDA stream events or kernel │
│   mismatches across ranks.                                             │
│ • In a 1,024-GPU ring, ALL 1,024 nodes report timeout errors!          │
│ • Locating the root-cause culprit historically required hours of blind │
│   binary-search NCCL tests.                                            │
├────────────────────────────────────────────────────────────────────────┤
│ 2. Fail-Slows & Hardware Stragglers                                    │
│ • A GPU throttles its core clock due to cooling failures or power caps.│
│ • InfiniBand PCIe links negotiate down from Gen5 to Gen1, or memory    │
│   controllers flood logs with silent ECC single-bit error corrections. │
│ • The cluster continues running, but step time degrades by 30% to 50%. │
├────────────────────────────────────────────────────────────────────────┤
│ 3. Subtle Performance Micro-Regressions                                │
│ • Minute slowdowns (e.g., 2% to 4%) caused by host CPU scheduling,     │
│   Python GIL contention, or misaligned asynchronous CUDA launch queues.│
│ • Impossible to detect via coarse macro-metrics (like iteration time), │
│   yet silently wastes hundreds of thousands of dollars over weeks.     │
└────────────────────────────────────────────────────────────────────────┘ Why Existing Diagnostic Profilers Fail in Production
When training stalls or slows down, site reliability engineers (SREs) instinctively reach for profiling tools like PyTorch Profiler, NVIDIA Nsight Systems, or DCGM. However, deploying these tools in active production environments encounters three fatal barriers:
- Punishing Tracing Overhead: Standard profilers inject heavy CPU hooks and force device synchronizations, inducing 5% to 15% latency overhead, which distorts the very timing anomalies being diagnosed.
- Massive Trace Log Bloat: Capturing fine-grained kernel execution traces across 6,000 GPUs generates hundreds of gigabytes per second, quickly exhausting cluster storage and network bandwidth.
- The Call-Stack Disconnect: Hardware telemetry (like DCGM GPU utilization) knows nothing about model architecture, while Python-level profilers know nothing about low-level NCCL ring topologies. Engineers are left with isolated logs and zero causal attribution.
FLARE System Architecture: Full-Stack Non-Intrusive Observability
To overcome these diagnostic blind spots, a research collaboration between Shanghai Jiao Tong University, Ant Group, and the National University of Singapore introduced FLARE: Anomaly Diagnostics for Divergent LLM Training in GPU Clusters of Thousand-Plus Scale at USENIX NSDI 2026.
FLARE is an end-to-end distributed diagnostic framework integrated into DLRover (under the LF AI & Data Foundation) designed specifically for continuous, non-intrusive monitoring of thousand-plus GPU clusters.
FLARE System Architecture Overview:
┌───────────────────────────────────────────────────────────────────────────────────────┐
│ DISTRIBUTED GPU CLUSTER (1,024 to 6,000+ GPUs)                                        │
│ ┌─────────────────────────┐ ┌──────────────────────────┐ ┌──────────────────────────┐│
│ │ Python Model Framework  │ │ C++ Runtime Interception │ │ CUDA Kernel Stream       ││
│ │ (Megatron-LM / PyTorch) │ │ (NCCL Collectives / OPs) │ │ (Asynchronous Events)    ││
│ └────────────┬────────────┘ └────────────┬─────────────┘ └────────────┬─────────────┘│
└──────────────┼───────────────────────────┼────────────────────────────┼───────────────┘
               │                           │                            │
               ▼                           ▼                            ▼
┌───────────────────────────────────────────────────────────────────────────────────────┐
│ LIGHTWEIGHT TRACING DAEMON (Incurs only 0.43% Latency Overhead)                       │
│ • Non-intrusive dynamic interception (No code changes / No recompilation)             │
│ • Asynchronous CUDA Event Logging via Background Timing Manager                       │
│ • Call-Stack Lineage Reconstruction: Stitches Python OPs to CUDA Kernels              │
└───────────────────────────────────┬───────────────────────────────────────────────────┘
                                    │ Low-Footprint Event Stream (~1.5 MB/GPU)
                                    ▼
┌───────────────────────────────────────────────────────────────────────────────────────┐
│ FLARE DIAGNOSTIC ENGINE                                                               │
│ ┌──────────────────────────────────────┐ ┌──────────────────────────────────────────┐ │
│ │ Intra-Kernel Inspecting Engine       │ │ Regression & Slowdown Analyzer           │ │
│ │ • O(1) NCCL Hang & Deadlock Isolation│ │ • Issue Latency Distribution (ILD)       │ │
│ │ • Pinpoints Root-Cause Faulty Rank   │ │ • Catches Subtle 2.66% Micro-Regressions │ │
│ └──────────────────────────────────────┘ └──────────────────────────────────────────┘ │
└───────────────────────────────────┬───────────────────────────────────────────────────┘
                                    │
                                    ▼
┌───────────────────────────────────────────────────────────────────────────────────────┐
│ AUTOMATED CLUSTER REMEDIATION                                                         │
│ • Isolate / Evict Straggler GPU Node  • Hot-Swap Backup Worker Node                   │
│ • Resume Training from Healthy State Without Full Cold-Restart                        │
└───────────────────────────────────────────────────────────────────────────────────────┘ FLARE is engineered around three foundational innovations:
- Lightweight Full-Stack Tracing Daemon: Instruments the training runtime from high-level Python APIs down to low-level CUDA driver calls with an ultra-low 0.43% runtime overhead and a trace log footprint of just 1.5 MB per GPU.
- Intra-Kernel Inspecting Engine: Automatically analyzes call-stack lineages and kernel progress states to diagnose communication deadlocks and hang errors in $O(1)$ complexity, eliminating brute-force NCCL tests.
- Regression & Slowdown Analyzer: Uses novel micro-metrics—specifically Issue Latency Distribution (ILD)—to detect subtle performance regressions as small as 2.66% that evade traditional macro-metrics.
Deep Dive: Lightweight Asynchronous Call-Stack Reconstruction
Achieving full-stack visibility without degrading training throughput requires rethinking how software hooks interact with asynchronous GPU execution.
Non-Intrusive Multi-Tier Interception
FLARE avoids intrusive source-code modifications. Instead, it deploys plug-and-play dynamic instrumentation:
- Python Layer: Wraps PyTorch tensor dispatch tables and
torch.autogradoperators to capture high-level model context (e.g.,SelfAttention.forward,Linear.backward). - C++ Layer: Intercepts runtime calls through dynamic library hooking (
LD_PRELOAD) to trace PyTorch C++ extensions and collective communication calls. - CUDA Layer: Intercepts CUDA driver and runtime APIs (
cudaLaunchKernel,ncclAllReduce) to track GPU stream dispatches.
Eliminating GPU Stalls with Asynchronous CUDA Events
Traditional profilers measure GPU kernel execution by inserting cudaDeviceSynchronize(), which forces the host CPU to halt until the GPU finishes all pending operations. This drains the GPU execution pipeline and introduces massive bubbles.
FLARE completely avoids host synchronization. Instead, upon intercepting a kernel launch, FLARE injects lightweight CUDA Events into the target CUDA stream:
Asynchronous CUDA Event Tracking in FLARE:
Training Thread (CPU):
Launch Kernel K ──► Enqueue Event E_start ──► Launch Kernel ──► Enqueue Event E_end ──► Continue!
                                                                                          ▲
                                                                     Zero CPU Stalls! (Non-Blocking)

Background Timing Manager Thread:
┌─────────────────────────────────────────────────────────────────────────────────────────┐
│ Background Loop: Periodically queries cudaEventQuery(E_end) in low-priority thread.    │
│ When completed: Calculates duration = cudaEventElapsedTime(E_start, E_end).           │
│ Reconstructs exact kernel start/stop timestamps without EVER stalling the model training│
└─────────────────────────────────────────────────────────────────────────────────────────┘ Call-Stack Lineage Stitching
Because Python dispatches, C++ runtimes, and CUDA kernels execute asynchronously, raw trace events arrive out of order. FLARE’s tracing daemon uses timestamp interval containment to reconstruct the hierarchical call tree:
$$\text{Kernel } K \in \text{Operator } OP \iff [T_{start}(K), T_{end}(K)] \subseteq [T_{start}(OP), T_{end}(OP)]$$
This links every GPU microsecond of execution directly back to the specific line of model code, attention head, or communication collective that spawned it.
Intra-Kernel Inspecting: O(1) NCCL Communication Deadlock Localization
One of the most persistent operational nightmares in distributed training is the communication hang.
In a ring-based collective communication pattern (such as NCCL Ring All-Reduce), GPUs are arranged in a logical ring where each rank forwards intermediate chunks to its successor. If GPU Rank 42 suffers an unrecoverable hardware exception or stalls during an intra-node NVLink copy, it stops sending data to Rank 43. Rank 43 stalls waiting for Rank 42, Rank 44 stalls waiting for Rank 43, and within milliseconds, all 1,024 GPUs in the ring freeze.
The Ring Communication Deadlock Cascade:
Rank 40 ──► Rank 41 ──► [Rank 42 FAILS!] ──► Rank 43 (Waiting) ──► Rank 44 (Waiting) ──► ...
                          ▲ ROOT CAUSE!
Result: Every single rank in the 1,024-GPU ring times out after 1,800 seconds!
        Traditional NCCL logs report: "Rank X timed out waiting for collective."
How do you find Rank 42 without testing all 1,024 nodes? The Failure of Traditional NCCL Binary Searches
Historically, when a cluster hung, SREs had to terminate the entire job, partition the cluster into sub-rings, and run synthetic NCCL tests iteratively. In a 1,024-GPU cluster, isolating the broken machine required multiple rounds of binary search, consuming 3 to 6 hours of cluster downtime.
FLARE’s O(1) Call-Stack Diagnostic Engine
FLARE eliminates binary search entirely through Intra-Kernel Inspecting. When a collective timeout occurs, FLARE does not inspect just the high-level timeout error; it inspects the reconstructed call stack and in-flight kernel execution states across all ranks simultaneously:
FLARE O(1) Root-Cause Isolation Logic:
┌────────────────────────────────────────────────────────────────────────┐
│ For every GPU Rank i:                                                  │
│ 1. Retrieve the in-flight operation from local call-stack tracker.      │
│ 2. Check kernel execution state:                                       │
│    - Status A: Kernel NOT yet launched (Rank is stuck in CPU compute). │
│    - Status B: Kernel launched, but 0 bytes transferred (Blocked on Rx)│
│    - Status C: Kernel launched, actively transmitting, but stalled.    │
│    - Status D: Kernel crashed / Hardware exception recorded in driver. │
└───────────────────────────────────┬────────────────────────────────────┘
                                    │
                                    ▼
┌────────────────────────────────────────────────────────────────────────┐
│ Anomaly Evaluation:                                                    │
│ In a ring of size N, exactly ONE rank will exhibit Status D (or        │
│ Status A while all others are in Status B waiting for it).             │
│ Root Cause = Rank with the earliest initiation failure!                │
│ Diagnostic Complexity: O(1) lookup across the aggregated trace state!  │
└────────────────────────────────────────────────────────────────────────┘ By querying the in-flight call stacks of all nodes at the moment of the hang, FLARE identifies the exact faulty machine, PCIe bus ID, and physical server rack in under 3 seconds with zero synthetic testing!
Detecting Micro-Regressions: Issue Latency Distribution (ILD)
While fatal hangs are obvious, subtle performance regressions are far more insidious. A 2.66% slowdown on a 6,000-GPU cluster represents the financial equivalent of keeping 160 high-end GPUs completely idle 24/7.
Traditional cluster monitors track macro-metrics like Iteration Step Time (e.g., 850 ms/step) or TFLOPS. However, due to natural batch variability, step times fluctuate by ±3% to ±5% from step to step, completely masking a persistent 2.66% regression.
FLARE introduces a new micro-metric: Issue Latency Distribution (ILD).
Understanding Issue Latency (T_issue):
┌────────────────────────────────────────────────────────────────────────┐
│ CPU Training Thread:                                                   │
│ [Python Dispatch: Tensor.matmul] ──────────────────────────┐           │
│                                                            │ T_issue   │
│                                                            ▼           │
│ [CUDA Runtime: cudaLaunchKernel] ──► Pushed to CUDA Stream Queue       │
└────────────────────────────────────────────────────────────────────────┘ Issue Latency ($T_{issue}$) is the precise elapsed time between when a Python framework operator completes dispatch and when the corresponding CUDA launch API enqueues the kernel onto the hardware stream.
Under normal execution, $T_{issue}$ exhibits a tightly bounded, sub-microsecond distribution. When host CPU contention, memory bandwidth saturation, or Python thread synchronization degrades, $T_{issue}$ displays a heavy right-tail distribution:
Issue Latency Distribution (ILD) Signature:
Probability
Density
  ▲
  │     Healthy Baseline (Mean: 0.8 us)
  │       ┌─┐
  │      ┌┘ └┐
  │     ┌┘   └┐          Micro-Regression Detected! (Mean: 4.2 us, Heavy Tail)
  │    ┌┘     └┐         ┌───────────┐
│ ──┴───────┴─────────┴───────────┴────────────────────────► Issue Latency (us) By computing the Kullback-Leibler (KL) divergence or Wasserstein distance between the runtime ILD and the calibrated healthy baseline, FLARE detects regressions as small as 1.5% within 10 training steps, pointing engineers directly to host-side thread contention or driver misconfigurations.
Implementation Blueprint: Building a FLARE Tracing & Anomaly Detector in Python
Below is a complete, runnable Python implementation demonstrating the core mechanics of FLARE: asynchronous CUDA event tracking, hierarchical call-stack interval stitching, $O(1)$ NCCL hang isolation, and Issue Latency Distribution (ILD) regression detection.
"""
flare_diagnostics.py
Core implementation of FLARE distributed training diagnostics:
- Asynchronous execution timing and call-stack stitching
- O(1) collective communication hang root-cause isolation
- Issue Latency Distribution (ILD) micro-regression detection
"""

from dataclasses import dataclass, field
import time
from typing import Dict, List, Optional, Tuple
import numpy as np


@dataclass
class TraceEvent:
    name: str
    layer_type: str  # "python", "cpp", "cuda"
    start_ts: float
    end_ts: float
    rank_id: int
    metadata: Dict[str, str] = field(default_factory=dict)

    def duration(self) -> float:
        return self.end_ts - self.start_ts


@dataclass
class CallStackNode:
    event: TraceEvent
    children: List['CallStackNode'] = field(default_factory=list)


class CallStackReconstructor:
    @staticmethod
    def build_call_tree(events: List[TraceEvent]) -> List[CallStackNode]:
        """
        Reconstructs hierarchical call-stack tree from flat timestamped events
        using interval containment: [start_child, end_child] within [start_parent, end_parent].
        """
        if not events:
            return []

        # Sort events by start time ascending, then by duration descending
        sorted_events = sorted(events, key=lambda e: (e.start_ts, -(e.end_ts - e.start_ts)))
        root_nodes: List[CallStackNode] = []
        stack: List[CallStackNode] = []

        for evt in sorted_events:
            node = CallStackNode(event=evt)
            # Pop nodes from stack that finished before current event started
            while stack and stack[-1].event.end_ts < evt.start_ts:
                stack.pop()

            if stack:
                stack[-1].children.append(node)
            else:
                root_nodes.append(node)

            stack.append(node)

        return root_nodes


class HangDiagnosticEngine:
    @staticmethod
    def diagnose_collective_hang(
        cluster_in_flight_events: Dict[int, TraceEvent]
    ) -> Tuple[int, str]:
        """
        O(1) Root-Cause Faulty Machine Isolation:
        Analyzes the active in-flight operation across all ranks at hang timeout.
        Identifies the rank that stalled first or failed to reach collective launch.
        """
        # Look for ranks that failed to reach the collective (stuck in earlier operator)
        collective_ranks = []
        non_collective_ranks = []

        for rank, evt in cluster_in_flight_events.items():
            if "nccl" in evt.name.lower() or "allreduce" in evt.name.lower():
                collective_ranks.append((rank, evt))
            else:
                non_collective_ranks.append((rank, evt))

        # Scenario 1: One rank is stuck in compute, causing all other ranks to hang in AllReduce
        if non_collective_ranks:
            faulty_rank, stuck_evt = non_collective_ranks[0]
            reason = (
                f"Rank {faulty_rank} stalled in local compute ({stuck_evt.name}), "
                f"failing to enter collective barrier."
            )
            return faulty_rank, reason

        # Scenario 2: All ranks entered collective, but one rank experienced hardware exception
        # Find the rank that initiated earliest but transferred least data
        earliest_rank = min(collective_ranks, key=lambda r: r[1].start_ts)
        faulty_rank = earliest_rank[0]
        reason = (
            f"Rank {faulty_rank} initiated collective ({earliest_rank[1].name}) "
            f"at ts={earliest_rank[1].start_ts:.4f} but stalled during transmission (Hardware/Link Failure)."
        )
        return faulty_rank, reason


class IssueLatencyAnalyzer:
    def __init__(self, baseline_samples: List[float]):
        self.baseline_mean = float(np.mean(baseline_samples))
        self.baseline_std = float(np.std(baseline_samples))

    def evaluate_regression(self, current_samples: List[float]) -> Dict[str, float]:
        """
        Evaluates Issue Latency Distribution (ILD) shift against healthy baseline.
        """
        curr_mean = float(np.mean(current_samples))
        curr_p99 = float(np.percentile(current_samples, 99))
        slowdown_pct = ((curr_mean - self.baseline_mean) / self.baseline_mean) * 100.0

        is_regression = slowdown_pct > 2.0  # Detect regressions >= 2.0%

        return {
            "baseline_mean_us": self.baseline_mean * 1e6,
            "current_mean_us": curr_mean * 1e6,
            "current_p99_us": curr_p99 * 1e6,
            "slowdown_percentage": slowdown_pct,
            "is_regression": float(is_regression),
        }


if __name__ == "__main__":
    print("[FLARE] Initializing Distributed Training Anomaly Diagnostic Engine...")

    # 1. Simulate Call-Stack Reconstruction on Rank 0
    t0 = time.time()
    mock_events = [
        TraceEvent("TransformerBlock.forward", "python", t0, t0 + 0.080, 0),
        TraceEvent("SelfAttention.forward", "python", t0 + 0.005, t0 + 0.045, 0),
        TraceEvent("aten::matmul", "cpp", t0 + 0.008, t0 + 0.040, 0),
        TraceEvent("ampere_sgemm_128x128", "cuda", t0 + 0.010, t0 + 0.038, 0),
        TraceEvent("ncclAllReduce", "cpp", t0 + 0.050, t0 + 0.075, 0),
    ]

    call_tree = CallStackReconstructor.build_call_tree(mock_events)
    print(f"\n[Call-Stack Tree] Reconstructed root: {call_tree[0].event.name} with {len(call_tree[0].children)} direct sub-ops.")

    # 2. Simulate Collective Hang Diagnosis on 8 Ranks
    # Ranks 0..6 entered ncclAllReduce, but Rank 7 stalled in backward gradient clipping!
    cluster_in_flight = {
        r: TraceEvent("ncclAllReduce", "cpp", t0 + 0.100, t0 + 10.0, r) for r in range(7)
    }
    cluster_in_flight[7] = TraceEvent("torch.nn.utils.clip_grad_norm_", "python", t0 + 0.090, t0 + 10.0, 7)

    faulty_node, diagnosis = HangDiagnosticEngine.diagnose_collective_hang(cluster_in_flight)
    print(f"\n[Hang Diagnosis] Identified Faulty Rank: {faulty_node}")
    print(f"  -> Root Cause: {diagnosis}")

    # 3. Simulate Issue Latency Distribution (ILD) Micro-Regression Detection
    np.random.seed(42)
    healthy_baseline = np.random.normal(loc=1.2e-6, scale=0.1e-6, size=1000).tolist()
    regressed_workload = np.random.normal(loc=1.235e-6, scale=0.15e-6, size=1000).tolist()  # +2.9% slowdown

    analyzer = IssueLatencyAnalyzer(healthy_baseline)
    metrics = analyzer.evaluate_regression(regressed_workload)

    print(f"\n[Micro-Regression Analysis]")
    print(f"  -> Baseline Mean: {metrics['baseline_mean_us']:.3f} us")
    print(f"  -> Current Mean:  {metrics['current_mean_us']:.3f} us")
    print(f"  -> Slowdown:      {metrics['slowdown_percentage']:.2f}%")
print(f" -> Anomaly Flag: {'ALERT: Regression Detected!' if metrics['is_regression'] else 'Normal'}") 6,000-GPU Production Evaluation & Real-World Case Studies
In the USENIX NSDI 2026 paper, the authors evaluated FLARE across a continuous 8-month production deployment at Ant Group, monitoring multi-thousand GPU clusters training multimodal, reasoning, and foundation language models.
FLARE Production Deployment Scale & Overhead Metrics:
┌────────────────────────────────────────────────────────┐
│ Metric                          Observed Value         │
├────────────────────────────────────────────────────────┤
│ Total Monitored Scale           6,000+ Production GPUs │
│ Evaluation Testbeds             1,024 to 1,536 H800 GPUs│
│ Continuous Operation Duration   8+ Months              │
│ Tracing Latency Overhead        0.43% Average Overhead │
│ Trace Log File Size             1.5 MB per GPU / run   │
│ Hang Anomaly Isolation Time     < 3.2 Seconds          │
│ Regression Detection Threshold  Catches 2.66% Slowdowns │
└────────────────────────────────────────────────────────┘ Real-World Case Study 1: The 2.66% Silent Micro-Regression
During pre-training of a 70B parameter multimodal model on 1,536 NVIDIA H800 GPUs, cluster iteration time suddenly degraded by 2.66% following an upgrade of the CUDA driver and host OS kernels.
- Traditional Monitoring: Prometheus and DCGM showed no hardware errors; GPU utilization remained pegged at 98%. SREs assumed the minor fluctuation was normal data loading jitter.
- FLARE Diagnosis: The Issue Latency Analyzer flagged an immediate right-tail shift in the Issue Latency Distribution ($T_{issue}$ jumped from 1.1 $\mu$s to 4.8 $\mu$s). By examining the reconstructed call stack, FLARE isolated the root cause: the updated OS kernel had altered Linux CPU governor thread affinity settings, causing the PyTorch data dispatcher to share CPU cores with background logging daemons.
- Remediation: Restoring core isolation eliminated the delay immediately, saving over $140,000 in cluster compute costs for the remainder of the run.
Real-World Case Study 2: The InfiniBand Optical Transceiver Failure
During a 1,024-GPU pre-training run, the entire job deadlocked during an All-Reduce barrier.
- Traditional SRE Workflow: Without FLARE, isolating the culprit would have required restarting the job with
NCCL_DEBUG=INFO, analyzing 1,024 separate log files, and conducting iterative binary-search ring diagnostics over 4 hours. - FLARE Diagnosis: Within 2.8 seconds of the hang timeout, FLARE’s Intra-Kernel Inspecting Engine parsed the active call stacks. While 1,023 ranks were waiting in
ncclAllReducereceive buffers, Rank 487 was stuck in an InfiniBand driver write queue. DCGM hardware cross-referencing revealed that Rank 487’s optical transceiver had experienced a sudden signal degradation event (high bit-error rate). - Remediation: The cluster orchestrator automatically evicted Node 487, assigned a hot-standby node, and resumed training from the latest checkpoint in under 90 seconds.
Production Engineering Runbook: Deploying FLARE with DLRover
To integrate FLARE into your distributed PyTorch, Megatron-LM, or DeepSpeed training clusters, follow this step-by-step engineering runbook:
FLARE Deployment Workflow:
1. Install FLARE Agent via DLRover
   └── pip install dlrover[flare]

2. Attach Lightweight Tracing Daemon (Zero Code Changes)
   └── Launch training script with Python preload hook:
       python -m dlrover.flare.launcher --config flare_config.yaml train.py

3. Configure Background Log Exporter & Timing Manager
   ├── Set export interval: 60 seconds
   └── Enable asynchronous CUDA event tracking (0.43% overhead).

4. Enable Real-Time Anomaly Dashboard
└── Stream metrics to Prometheus / Grafana or centralized SRE alert webhook. Configuration Specification (flare_config.yaml)
flare_daemon:
  enabled: true
  sampling_rate: 1.0 # Continuous 100% tracing (overhead is only 0.43%)
  log_export_interval_sec: 60
  max_log_size_mb_per_gpu: 5.0

interceptors:
  python_framework: true
  cpp_runtime: true
  cuda_driver: true
  nccl_collectives: true

diagnostics:
  hang_detection:
    enabled: true
    timeout_threshold_sec: 300
    auto_isolate_faulty_rank: true

  regression_detection:
    enabled: true
    ild_threshold_percent: 2.0
    baseline_window_steps: 50
alert_webhook: 'https://alerts.internal.corp/flare/webhook' Production Launch Command (Megatron-LM Example)
# Launch 1,024-GPU training run with FLARE non-intrusive monitoring
torchrun \
  --nproc_per_node=8 \
  --nnodes=128 \
  --rdzv_id=llm_pretrain_run_42 \
  --rdzv_backend=c10d \
  --rdzv_endpoint=master-node:29500 \
  -m dlrover.flare.launcher \
  --config configs/flare_config.yaml \
  pretrain_gpt.py \
  --tensor-model-parallel-size 8 \
  --pipeline-model-parallel-size 8 \
  --num-layers 80 \
  --hidden-size 8192 \
  --num-attention-heads 64 \
--seq-length 8192 Once running, configure your enterprise telemetry or desktop copilots via developer documentation to monitor training health in real time. For enterprise teams planning multi-thousand GPU clusters, review our flexible pricing plans for dedicated systems reliability consultations.
Frequently Asked Questions (FAQ)
How does FLARE achieve such low overhead (0.43%) compared to PyTorch Profiler?
PyTorch Profiler and Nsight Systems rely on synchronous CPU-GPU hooks, heavy memory allocations, and full execution graphs that stall asynchronous pipelines. FLARE uses non-intrusive dynamic function hooking, injects asynchronous CUDA events into existing streams, and offloads timestamp polling and call-stack stitching to a low-priority background thread.
Does FLARE require modifying model source code?
No. FLARE attaches dynamically at launch time via Python and C++ runtime interception (dlrover.flare.launcher). It requires zero modifications to model definition scripts, Megatron-LM repos, or PyTorch source code.
Can FLARE diagnose non-communication issues, such as loss spikes or NaN gradients?
Yes. In addition to communication hangs and performance regressions, FLARE tracks numerical gradient norms and loss trajectory variance. When a loss spike or NaN tensor occurs, FLARE’s call-stack lineage pinpoints the exact layer, activation tensor, and batch sample index where numerical instability originated.
What hardware backends are supported?
FLARE supports NVIDIA GPUs (Ampere, Hopper, and Blackwell architectures with CUDA and NCCL), with ongoing community extensions for AMD Instinct GPUs (ROCm and RCCL) under the LF AI & Data Foundation DLRover project.